
How can urban delivery traffic be made more sustainable? Where are micro-hubs suitable? Which vehicles should be used, and how do traffic, demand, or urban structures influence the optimal solution?
The Green Delivery Analytics (GDA) project is developing a data-driven analytical model to address these questions. The goal is to link various types of information, including urban structure, package demand, delivery routes, and traffic, in such a way that different last-mile logistics scenarios can be analyzed and logistics networks optimized based on this data.
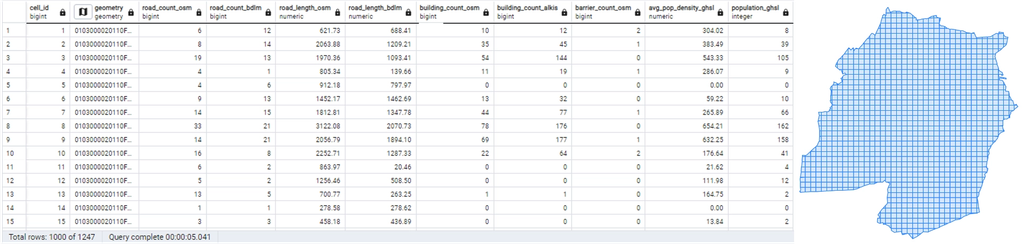
A key challenge here is the heterogeneity of the available data. Not all the information needed for network optimization is readily available. Therefore, missing variables are sometimes derived from existing data, estimated, or modeled. At the same time, information is standardized spatially and temporally, for example, using standardized city grids as shown in the figure below. Each row represents the aggregated data for a single grid cell. This allows patterns to be identified across different urban areas and, in the future, applied to other urban spaces as well.
The analytical model integrates four areas of analysis, thereby laying the foundation for optimizing logistics networks while taking into account urban structures, demand, traffic, and logistical conditions.
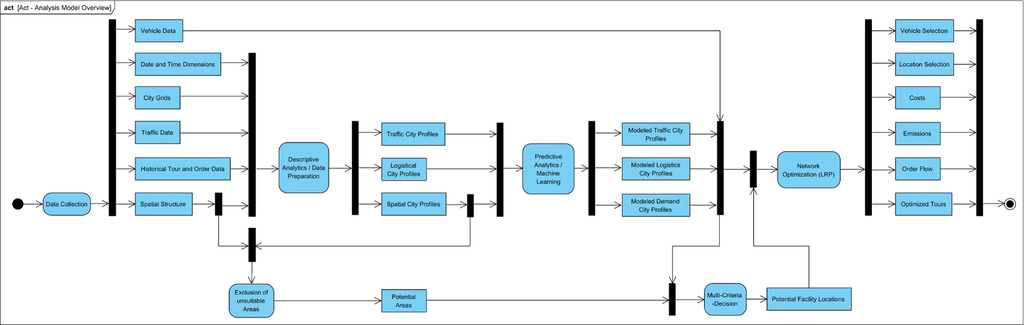
City Analysis: Spatial structure, sociodemographics, the logistics market, and other urban characteristics are combined to create spatial city profiles. Clustering and machine learning methods are used to identify comparable urban structures.
Order and Tour Analysis: Historical order and tour data are analyzed to map, among other things, demand, processing times, and logistical structures within a city. From this, logistical city profiles and modeled demand structures can be derived.
Traffic Analysis: Traffic data and information derived from route data are used to model spatiotemporal traffic profiles. This allows, for example, different driving speeds or traffic congestion levels to be incorporated into further planning.
Potential Locations Analysis: Unsuitable areas are first ruled out. The remaining areas are then evaluated based on spatial, logistical, traffic-related, and demand-related criteria. This results in a shortlist of potential locations for stationary or mobile logistics hubs.
The results of these analyses are ultimately incorporated into a joint network optimization process. There, decisions regarding, for example, locations, vehicle types, routes, costs, and emissions are to be considered collectively. The analytical model thus establishes a link between heterogeneous urban data and specific planning decisions.
This establishes a foundation not only for analyzing existing delivery structures but also for comparing different future scenarios: How does a logistics network change when cargo bikes are used? Where might micro-hubs be useful? And what are the impacts on costs, traffic, and emissions?
Green Delivery Analytics operates precisely at this intersection of data analysis and logistics planning.